
Pixalate examined invalid traffic ("IVT") trends across desktop, smartphone, and tablet devices during the "Big Game" in 2018 to identify trends and correlations to provide programmatic marketers with key takeaways to help them score a touchdown in future seasons.

According to Pixalate's research, IVT rates began to drop from their pre-game peak of about 8% roughly one hour before the "Big Game" kicked off.
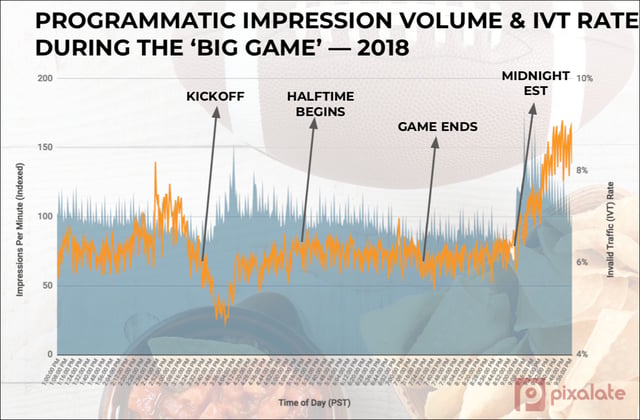
Just because IVT saw significant movement before and after kickoff does not mean it moved because of the "Big Game."
In fact, Pixalate research indicates that the timing of the kickoff happens to correlate with a usual decrease in IVT on Sundays. Pixalate examined hourly IVT patterns during the "Big Game" and compared them to hourly IVT patterns during other 2018 playoff football games, and found that the two had similar patterns.
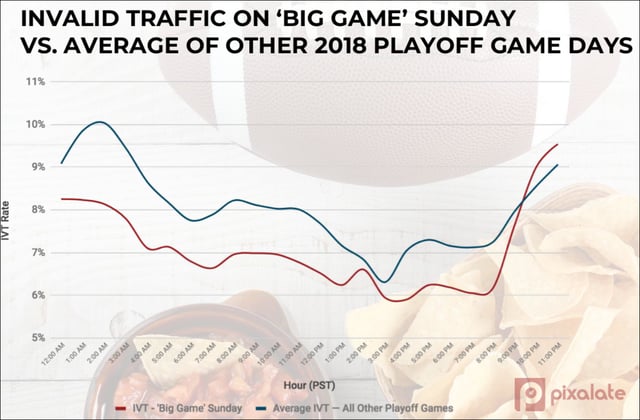 IVT was notably lower during the majority of "Big Game" Sunday when compared to other 2018 playoff game days.
According to this data, programmatic marketers don't need to shy away from "Big Game" Sunday because of invalid traffic (IVT). In fact, at least in 2018, there was the potential to take advantage of lower IVT rates.
 According to Pixalate's research, smartphones were the dominant device during the "Big Game."
Pixalate’s data science and analyst team analyzed billions of programmatic advertising impressions, including display and video ads, utilizing proprietary analytics and measurement tools to compile this research.
The research contained herein represents data collected by Pixalate between January 6, 2018, through February 4, 2018.
“Big Game” Sunday is a reference to Sunday, February 4, 2018. “All Other Playoff Game Days” refer to Saturday-Sunday, January 6-7; Saturday-Sunday, January 13-14; Sunday, January 21; and Sunday, January 28, 2018.
Pixalate measured programmatic advertising activity across desktops, smartphones (referred to as “mobile” in the report), and tablets for this study. Unless explicitly broken out by device type, the data refers to a combination of all measured devices and channels.
Invalid Traffic (“IVT”) rate refers to both General Invalid Traffic (“GIVT”) and Sophisticated Invalid Traffic (“SIVT”), as measured by Pixalate and as defined by the Media Rating Council (“MRC”).
Want more data-driven insights? Sign up for our blog!