Pixalate is today releasing updated invalid traffic (“IVT”) rates from the United States from May 2018 — and our analysis reveals that ad fraud remains a large problem for both web and in-app advertising.
Pixalate analyzed data from billions of impressions collected during May 2018 in order to determine the IVT levels in U.S. traffic. Learn more in our Q2 2018 Programmatic Quality Report.

Advertisers continue to cite ad fraud and traffic quality as major concerns, but IVT rates are not decreasing. With the proliferation of new formats, new opportunities for fraudulent activity arise, and the types of ad fraud impacting the programmatic ecosystem are multiplying.
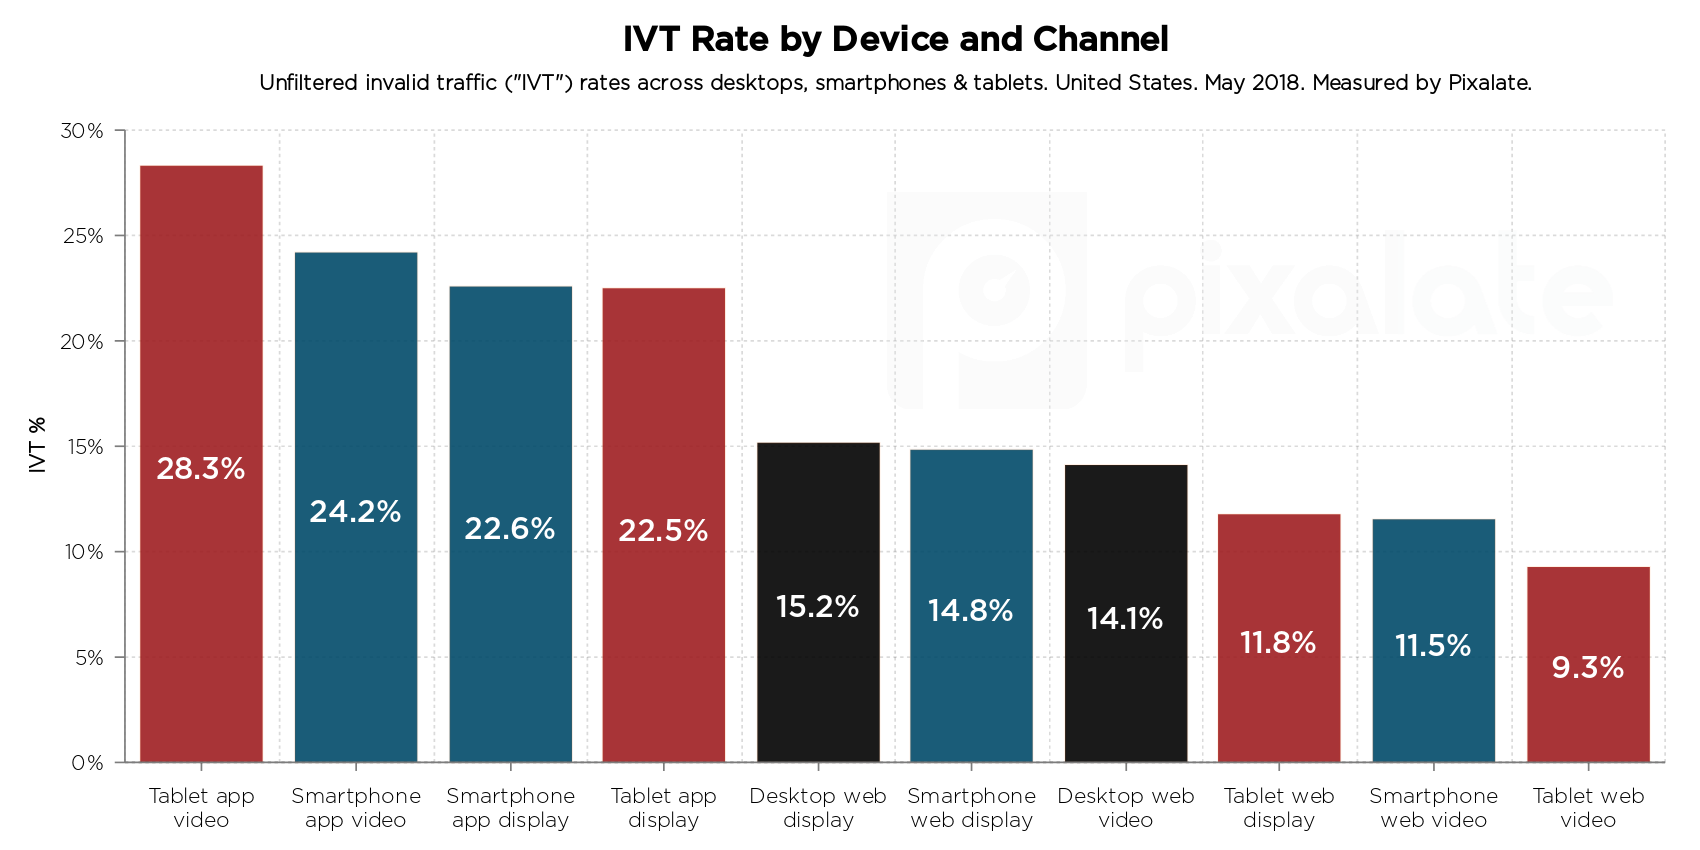
According to our data, mobile in-app programmatic advertising is the riskiest from an IVT perspective. In-app advertisements had an IVT rate between 22% and 29% across tablets and smartphones for both display and video advertising.
Web IVT rates — across both mobile and desktop devices — were about half that amount, in the 9% to 15% range.
According to eMarketer, about $60 billion will be spent on programmatic advertising in the U.S. in 2018, and about 64% of that ad spend will go to mobile devices. Within mobile ad spend, about 80% is directed toward mobile in-app advertising.
Fraudsters know that mobile — and, specifically, mobile in-app — is where marketers are spending their money. So it’s no surprise to see the mobile in-app has the highest IVT rate across the board.
The problem is extrapolated because marketers have a general lack of visibility into in-app advertising. So few companies are able to detect, monitor, and prevent ad fraud in-app, which creates an atmosphere ripe for exploitation..png?width=400&name=Time%20Spent%20with%20Mobile%20Apps,%20by%20Device%20(1).png)
If nothing changes, the money lost to mobile app ad fraud will only increase. There is rapid growth in user time spent within apps; eMarketer projects that U.S. users will spend 168 minutes per day within mobile apps this year — up from 40 minutes in 2012. That number will continue to climb, reaching 187 minutes per day in 2020.
Given the rapid growth in user engagement and ad volume, it has become paramount for every company in the app ecosystem — including app stores, app publishers, app networks, etc. — to be more committed to rooting out ad fraud. The marketplace needs more transparency regarding how ad fraud is occurring and how it is evolving across mobile apps.
Mobile in-app IVT rates are the highest across the board, but desktop IVT rates should still concern marketers. In fact, desktop web IVT rates were higher than mobile web IVT rates.
As our data reveals, 14.1% of desktop web video ads and 15.2% of desktop web display ads were measured as invalid in the U.S.
Mobile in-app may be the biggest IVT challenge marketers face, but the battle is taking place across all devices and channels.
Below are some practical steps marketers can take to reduce their exposure to IVT:
Pixalate analyzed billions of programmatic advertising impressions throughout May 2018 to compile the research contained herein. Pixalate utilized its proprietary algorithms to measure invalid traffic (“IVT”) levels across devices and channels. This data represents the United States programmatic marketplace. Geography is based off of the User Pool (IP) and not the region of the domain.
Pixalate is a cross-channel fraud intelligence company that works with brands and platforms to prevent invalid traffic and improve ad inventory quality.