The Android operating system powers over three-fourths of the world’s mobile devices — a startling number when considering the fact that Android devices are particularly prone to in-app ad fraud.
In this post, Pixalate dives into invalid traffic (“IVT”) rates across popular Android app categories. You can download the full Q2 2018 Programmatic Quality Report here.
Here are the latest Android in-app ad fraud trends, including a breakdown of what it means for marketers.
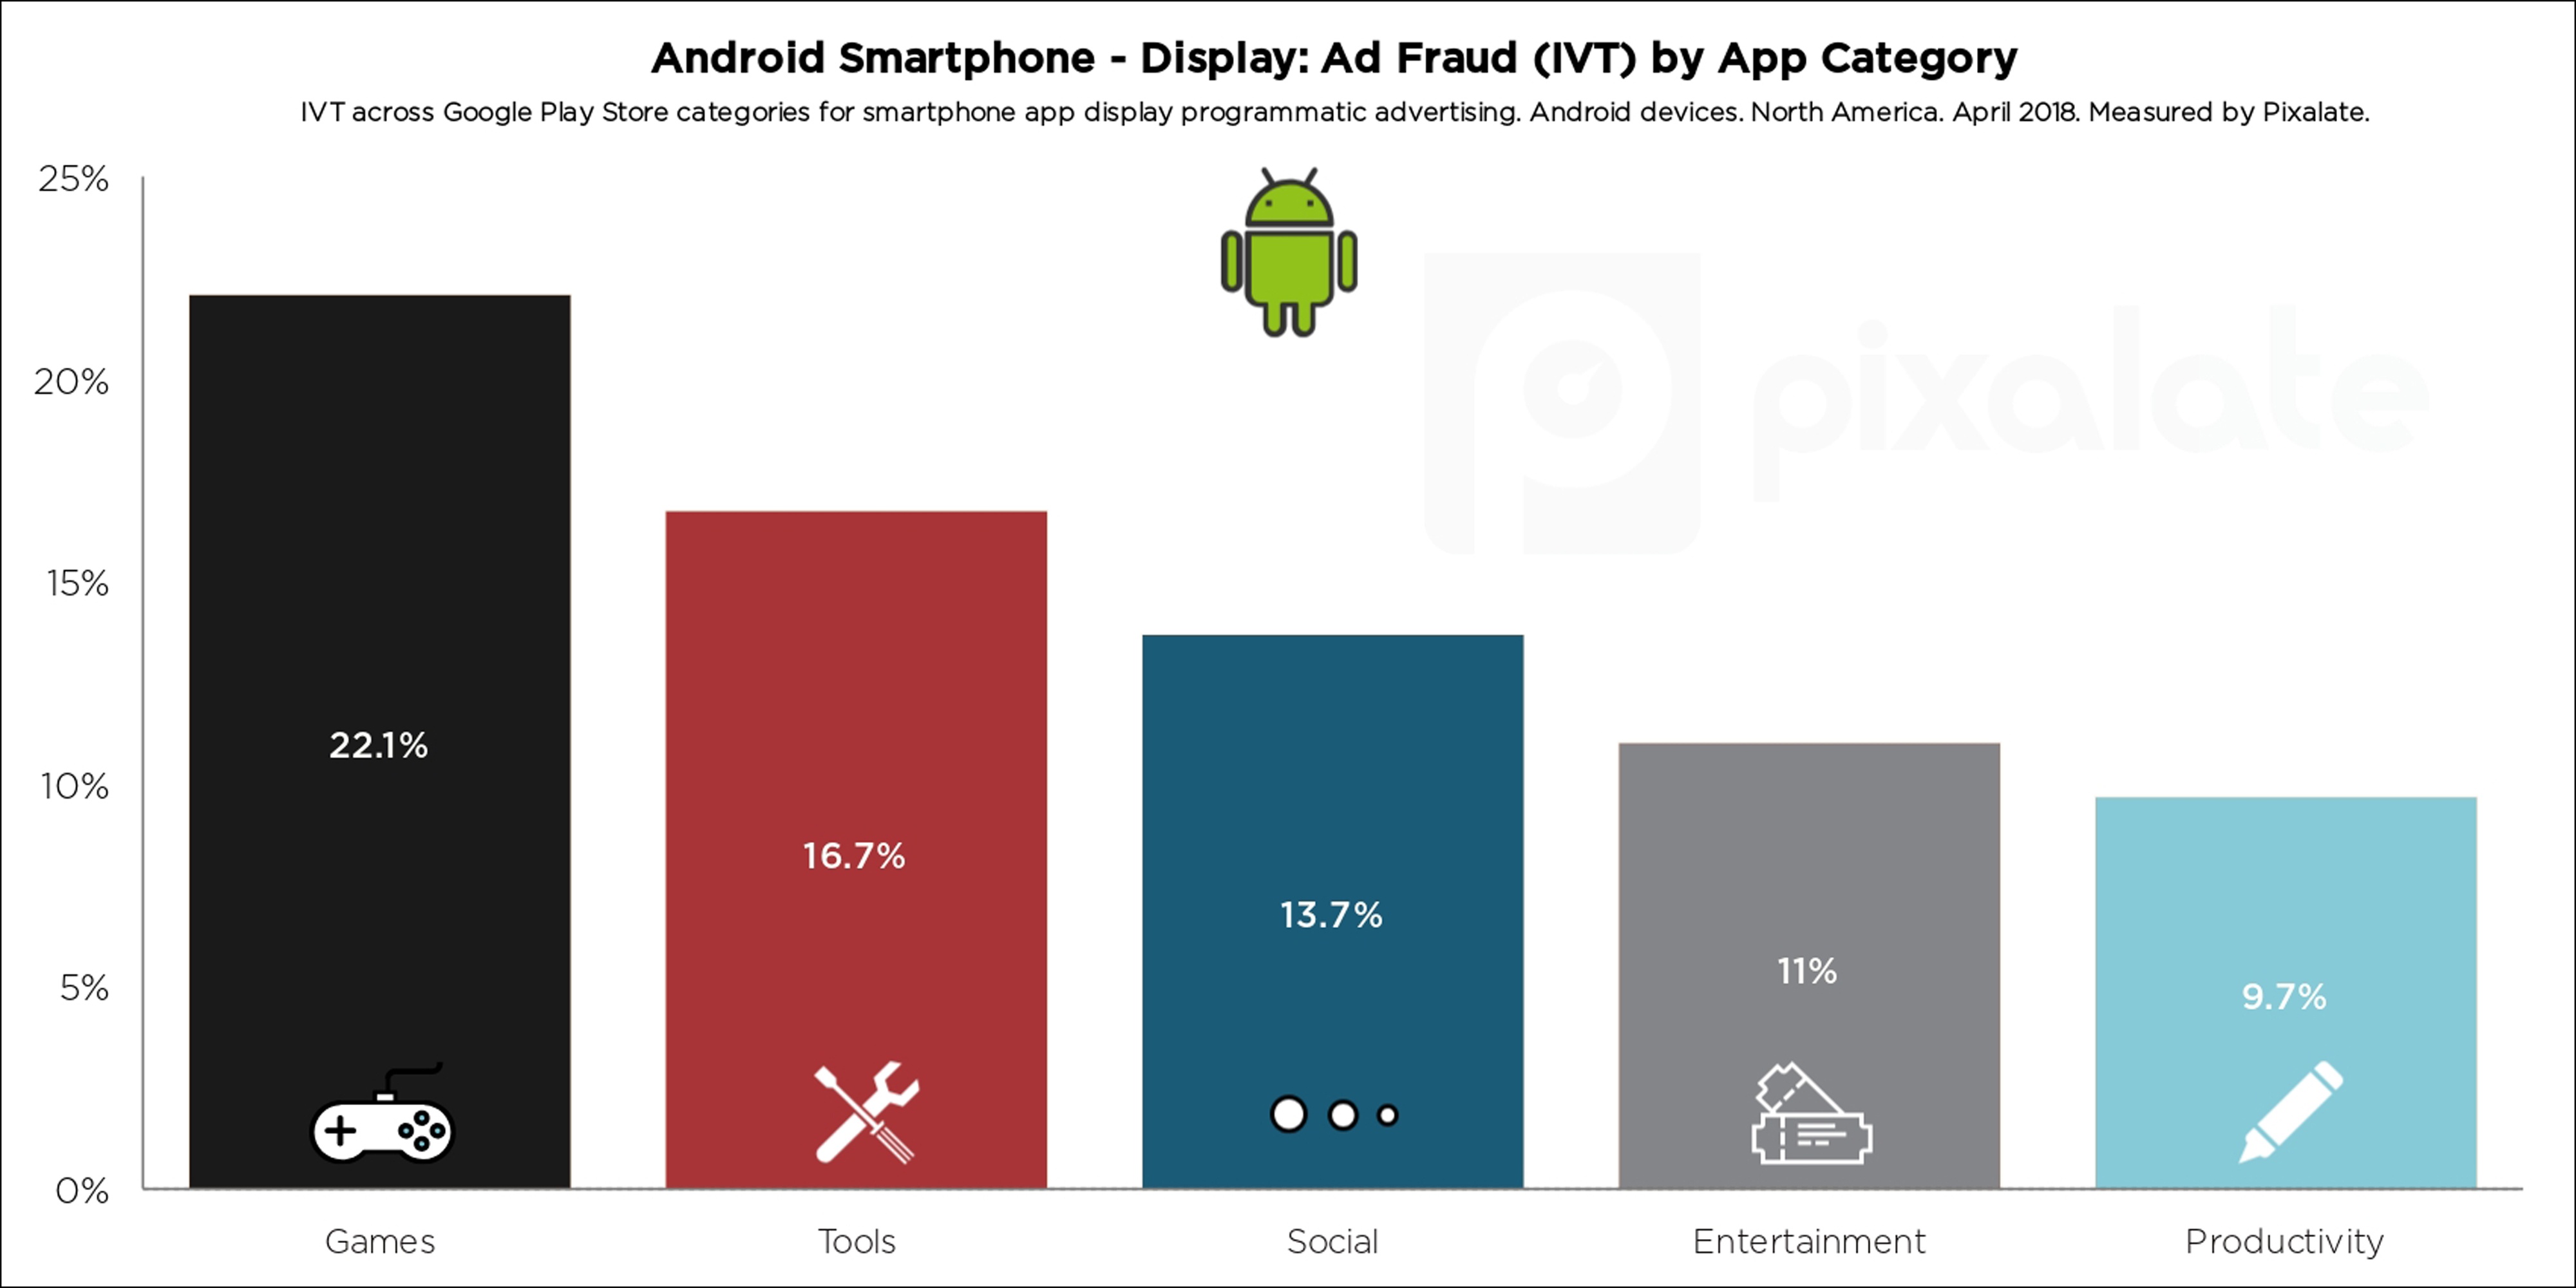
On Android smartphones, apps in the ‘Games’ category had a display IVT rate of 22.1% in the time period we examined.
The chart below shows the IVT rates for the five most popular Android smartphone app categories in terms of programmatic display advertising.
Over one-third (34.6%) of programmatic video ads served to apps in the ’Tools’ category on Android smartphones were invalid in the time period we studied.
The chart below shows the IVT rates for the five most popular Android smartphone app categories in terms of programmatic video advertising.
Fraudsters have found great success in stealing in-app display ad dollars on Android tablets — particularly in the ‘Entertainment’ category, which had an IVT rate of 58.2% in the time period we examined.
The chart below shows the IVT rates for the five most popular Android tablet app categories in terms of programmatic display advertising.
The ‘Tools’ category is one of the most susceptible to ad fraud across all Android devices. It has a nearly 50% IVT rate for video advertising on Android tablets.
The chart below shows the IVT rates for the five most popular Android tablet app categories in terms of programmatic video advertising.
Below are a few ways in which marketers can put this data to use:
Methodology
Pixalate analyzed billions of programmatic advertising impressions throughout April 2018 to compile the research contained herein. Pixalate utilized its proprietary algorithms to measure invalid traffic (“IVT”) levels across mobile devices — within mobile applications — for both display and video advertising. This data represents the North American programmatic marketplace. Geography is based on the User Pool (IP) and not the region of the domain. For IVT calculations, categories of mobile applications that had less than 1,000,000 impressions were removed. The ad Share of Voice (“SOV”) is based on all categories. App categories are based on categorizations as given by the official Google Play Store. Only apps from the official Google Play Store are included in these calculations.
About Pixalate
Pixalate is a cross-channel fraud intelligence company that works with brands and platforms to prevent invalid traffic and improve ad inventory quality.
*By entering your email address and clicking Subscribe, you are agreeing to our Terms of Use and Privacy Policy.
These Stories on Mobile


*By entering your email address and clicking Subscribe, you are agreeing to our Terms of Use and Privacy Policy.
Disclaimer: The content of this page reflects Pixalate’s opinions with respect to the factors that Pixalate believes can be useful to the digital media industry. Any proprietary data shared is grounded in Pixalate’s proprietary technology and analytics, which Pixalate is continuously evaluating and updating. Any references to outside sources should not be construed as endorsements. Pixalate’s opinions are just that - opinion, not facts or guarantees.
Per the MRC, “'Fraud' is not intended to represent fraud as defined in various laws, statutes and ordinances or as conventionally used in U.S. Court or other legal proceedings, but rather a custom definition strictly for advertising measurement purposes. Also per the MRC, “‘Invalid Traffic’ is defined generally as traffic that does not meet certain ad serving quality or completeness criteria, or otherwise does not represent legitimate ad traffic that should be included in measurement counts. Among the reasons why ad traffic may be deemed invalid is it is a result of non-human traffic (spiders, bots, etc.), or activity designed to produce fraudulent traffic.”