<img height="1" width="1" style="display:none" src="https://www.facebook.com/tr?id=134132097137679&amp;ev=PageView&amp;noscript=1">

Ad fraud trends: Digital advertising (2019)

Apr 8, 2019 11:00:00 AM

What are the latest ad fraud trends and invalid traffic (IVT) rates in programmatic advertising? Pixalate examines the latest data to give you the most up-to-date insight on ad fraud trends in digital advertising.

Download the most recent Ad Fraud Trends report for the full scoop on the current state of IVT and ad fraud in programmatic digital advertising. 

Download the Report

Ad fraud trends: Global programmatic invalid traffic (IVT) rates (Q4 2018)

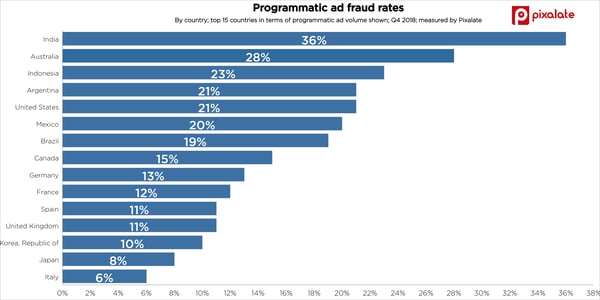
According to the latest ad fraud data, invalid traffic is on the rise even as advertisers become more aware of the tactics used by fraudsters.

ad-fraud-trends-invalid-traffic-ivt-by-country-q4-2018

  • The U.S. had an IVT rate of 21% in Q4, up from 17% in Q3
    • This was the fifth-highest IVT rate in the world
  • 10 of the top 15 countries in terms of programmatic ad volume saw an increase in IVT in Q4
    • U.S., Australia, Canada, Mexico, Germany, Italy, Brazil, Argentina, Korea, and India

Ad fraud trends: Programmatic display advertising (Q4 2018)

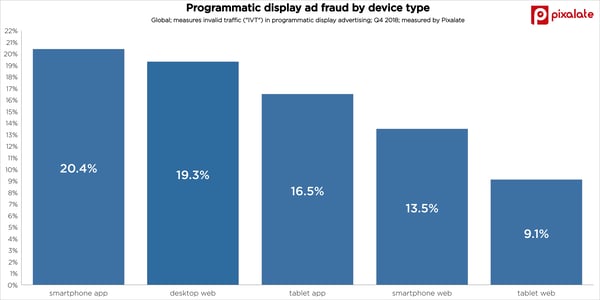
Smartphone in-app ad fraud has the highest invalid traffic rate, at over 20%. See the latest mobile ad fraud trends for more.

ad-fraud-trends-invalid-traffic-ivt-display-advertising-q4-2018

  • Over one-in-five (20.4%) smartphone in-app display ads were invalid in Q4 2018
    • Tablet app had a 16.5% ad fraud rate
  • Desktop web (19.3%) had the second-highest display IVT rate in Q4
    • This was an increase from 16.1% in Q3

Ad fraud trends: Programmatic video advertising (Q4 2018)

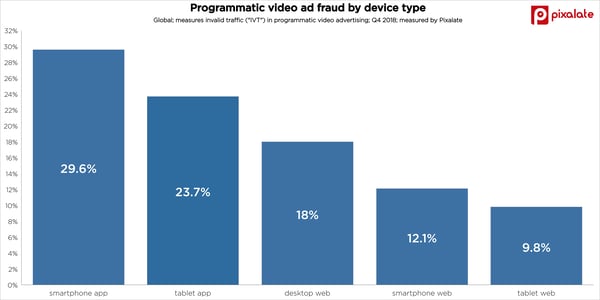
When it comes to programmatic video ad fraud trends, mobile in-app is the riskiest. See the mobile app fraud trends for details on the riskiest app categories. 

ad-fraud-trends-invalid-traffic-ivt-video-advertising-q4-2018

  • Smartphone in-app video (29.6%) and tablet in-app video (23.7%) had the highest programmatic video IVT rates in Q4
  • In contrast, smartphone web (12.1%) and tablet web (9.8%) had significantly lower IVT rates

Download the latest Ad Fraud Trends report for more information:

Download the Report

Still looking or more information about ad fraud?

For a high-level view of IVT in mobile advertising, view our mobile ad fraud trends.

For a more granular view of IVT in mobile advertising, view our mobile app fraud trends.

Search Blog

Follow Pixalate

Subscribe to our blog

*By entering your email address and clicking Subscribe, you are agreeing to our Terms of Use and Privacy Policy.

Subscribe to our blog

*By entering your email address and clicking Subscribe, you are agreeing to our Terms of Use and Privacy Policy.