Below you’ll find the individual lists of the top 10 trending apps for Android smartphones and tablets in EMEA from April 2018, based on programmatic video advertising share of voice.
Android devices account for the vast majority of the mobile market in the EMEA region. Given this, we have decided to share Android-specific rankings.
You can download the full list of the top 30 trending apps for each device here:

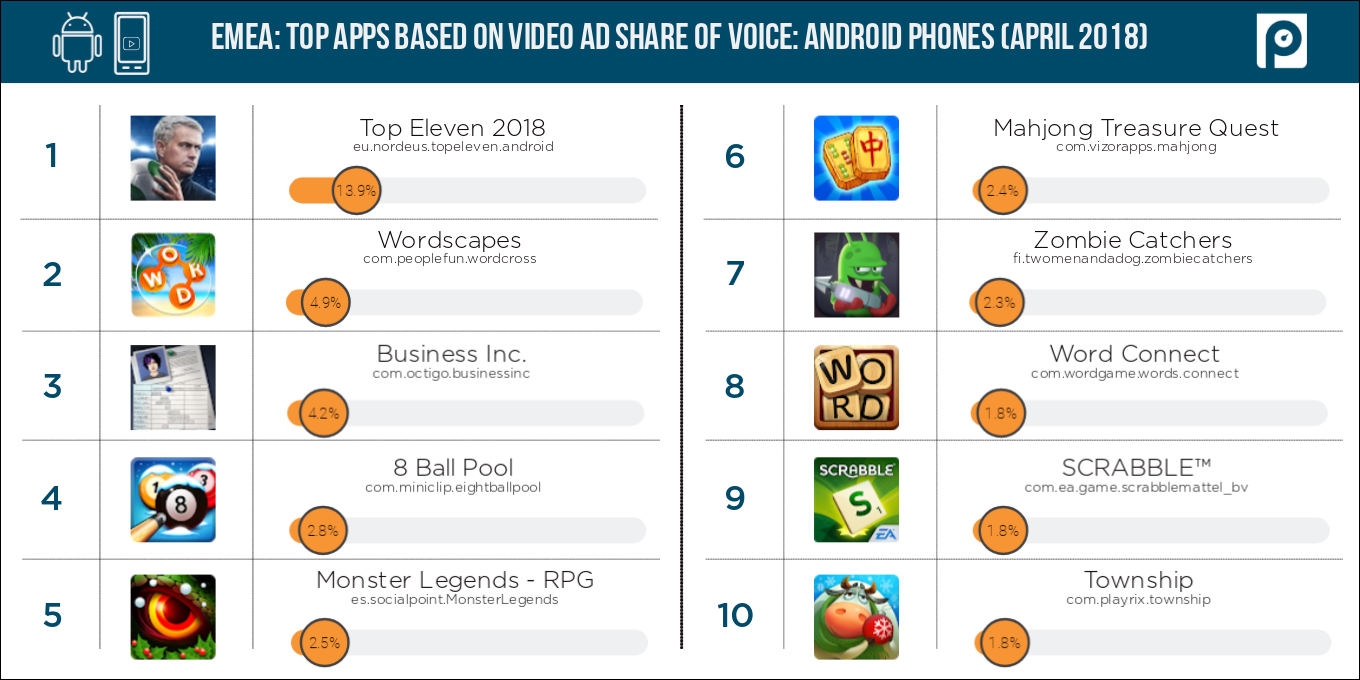
According to Pixalate's data, Top Eleven 2018, an app in which players manage a soccer team, was the top trending app on Android smartphones in EMEA in April 2018, based on programmatic video ad volume. Top Eleven 2018 had a market share of 13.9%.
A trio of word-based games, including Wordscapes (4.9% market share), Word Connect (1.8%), and SCRABBLE™ (1.8%) all ranked in the top 10.
.png?width=640&name=Video2-Android-phones-EMEA-share-of-voice-(April-2018-data).png)
According to Pixalate's data, Talking Tom Gold Run was the top app on Android tablets in EMEA in April 2018, based on programmatic video ad volume, with a market share of 9.1%.
Top Eleven 2018 ranked second, with a market share of 6.3%. It was the top app on Android smartphones.
.png?width=640&name=Video2-Android-tablets-EMEA-share-of-voice-(April-2018-data).png)
Pixalate examined mobile in-app video advertisements sold via programmatic channels in the EMEA region (Europe, the Middle East, and Africa) on Android devices throughout April 2018 for this study. The data is based on activity within apps that engage in programmatic advertising in the open marketplace. Invalid Traffic (IVT) — including General Invalid Traffic (GIVT) and Sophisticated Invalid Traffic (SIVT) — were removed prior to ranking the apps. Each app's "Share of Voice" is determined based on programmatic display ad volume as measured by Pixalate. The data contained herein is based solely on Pixalate's Share of Voice analysis of programmatic advertising impressions in April 2018, and any reference to "top" or "trending" apps refers solely to an app's Share of Voice of programmatic advertising impressions.
Sign up for our blog to stay updated with new stats, trends, and analysis of digital ad fraud.